

Quality Score is Google’s least-explained, most-expensive metric in your Google Ads account. A keyword with low ad quality (say Quality Score 4) can pay 2-3x the CPC of a comparable keyword with Quality Score 8 for the same ad position. Most Dallas businesses don’t realize their average Quality Score is silently inflating their CPC costs by 40-200% across hundreds of keywords. The cumulative annual cost: typically $15K-$80K in unnecessary spend for a Dallas business running moderate Google Ads volume.
The good news: Quality Score is fixable. Unlike Performance Max’s black-box optimization or Google’s evolving algorithm changes, Quality Score has three clearly-defined components, each measurable and improvable through specific tactical changes. The playbook below is systematic and repeatable: most accounts can lift average Quality Score from 5-6 to 7-8 within 60-90 days, recovering 30-50% of unnecessary CPC inflation.
Quality Score is Google’s 1-10 diagnostic rating of your keyword/ad/landing-page combination; the auction does not use the score itself, only the live ad quality it summarizes. Low Quality Score (1-5) inflates CPCs by 40-200% compared to high scores. The 3 components: expected CTR, ad relevance, and landing page experience. Each component has specific diagnostic indicators and fixable causes. Most Dallas Google Ads accounts can lift average Quality Score 2-3 points within 60-90 days through systematic optimization — recovering 30-50% of unnecessary CPC spend.
Looking for hands-on help instead of DIY? Skip ahead to our Google Ads Quality Score optimization.
The Quality Score Math That Costs You Money
How Quality Score Affects CPC
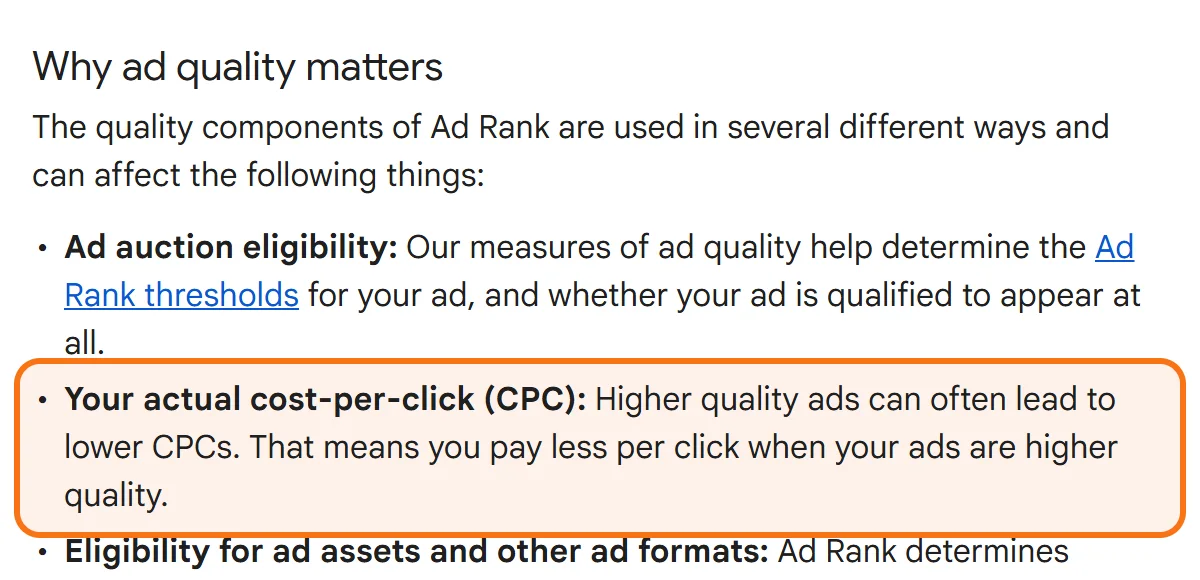
Google calculates Ad Rank in every auction from your bid, the quality of your ad and landing page at that moment, the competition, the context of the search and your ad assets. The 1-10 Quality Score in your account is a diagnostic summary of that quality, not a number the auction multiplies by your bid. The cost effect is still real: higher quality ads can often lead to lower CPCs.
The Real Cost in Dallas Verticals
Google sets no fixed price per score, because Quality Score is not an input in the auction; as a rough illustration, in a high-CPC Dallas commercial vertical with $15 average CPC the gap can look like:
- Quality Score 9-10: $6-$9 actual CPC
- Quality Score 7-8: $10-$14 actual CPC
- Quality Score 5-6: $15-$22 actual CPC
- Quality Score 3-4: $24-$38 actual CPC
- Quality Score 1-2: $40+ actual CPC (often unprofitable at any volume)
For a Dallas account spending $10,000/month, lifting average Quality Score from 5 to 8 typically recovers $2,500-$4,500/month in CPC inflation — without changing keyword strategy, ad copy, or landing pages dramatically.
The Three Quality Score Components
Component 1: Expected Click-Through Rate (CTR)
Google’s prediction of how likely your ad is to be clicked when shown for a specific search query. Predicted based on historical CTR data, ad copy relevance, and contextual signals.
Diagnostic Indicators in Google Ads
In keyword view, add the columns from the Quality score section to see three sub-ratings: Exp. CTR, Ad Relevance and Landing Page Exp. Each rated as “Below average,” “Average,” or “Above average.”
Causes of Below-Average Expected CTR
- Keyword doesn’t match ad copy — targeting “commercial property tax” but ad headlines say “residential”
- Keyword is too broad — targeting “insurance” instead of “commercial property insurance Dallas”
- Ad copy is generic — doesn’t include the keyword or close variations
- Weak call-to-action — lacks urgency or specificity
- Competitive ads are better — even good ads underperform when shown alongside great ads
Fixes for Expected CTR
- Restructure ad groups so each contains 5-15 closely related keywords (Single Keyword Ad Groups for high-value terms)
- Include the primary keyword in Headline 1 and Headline 2 of each responsive search ad
- Use specific numbers, prices, or locations in ad copy: “Get $200 off,” “Free Dallas consultation,” “verified reviews”
- Use ad assets (formerly called ad extensions) extensively: sitelinks (6+), callouts (8+), structured snippets, promotions, prices
- Run 3+ ad variations per ad group, regularly pruning lowest performers
Component 2: Ad Relevance
Google’s assessment of how closely your ad copy matches the intent of your keyword. Measured against search queries triggering the ad and competitor ad benchmarks.
Causes of Below-Average Ad Relevance
- Generic ad copy not specific to the keyword’s intent
- Mismatched intent — informational keyword with transactional ad copy or vice versa
- Missing keyword in display URL — doesn’t reinforce keyword-ad connection
- Outdated ad copy from previous campaigns with different positioning
Fixes for Ad Relevance
- Use Dynamic Keyword Insertion (DKI) cautiously in headlines to match query language
- Match ad copy intent layer to keyword intent layer (covered in our intent-based SEO article)
- Build separate campaigns for different intent layers within the same service category
- Test 3+ headline variations per ad with different angles (problem-focused, benefit-focused, proof-focused)
- Include keyword in display URL path: example.com/commercial-tax-appeal/dallas
Component 3: Landing Page Experience
Google’s evaluation of whether your landing page provides relevant, useful content for visitors arriving from the ad. Heavily influenced by load time, mobile experience, content relevance, and bounce-back behavior.
Causes of Below-Average Landing Page Experience
- Slow page load — covered in detail in our slow load times article
- Generic homepage as landing page — covered in our static homepage paid traffic article
- Content doesn’t match ad promise — ad mentions specific service, page covers everything
- Poor mobile experience — broken forms, slow load, illegible text
- High bounce-back rate — visitors immediately return to Google search results
- Lack of trust signals — no testimonials, no contact info, no business credentials
Fixes for Landing Page Experience
- Build dedicated landing pages matching each major ad campaign (covered in our landing page checklist article)
- Optimize page load to under 2 seconds (covered in our page speed article)
- Mobile-first design with 16px+ form input fonts to prevent iOS auto-zoom
- H1 mirrors ad headline language exactly
- Trust signals above the fold: ratings, reviews, certifications, client logos
- 3-field form maximum (covered in our form abandonment article)
The 7-Day Quality Score Diagnostic Workflow
Day 1: Audit Current State
In Google Ads, go to Keywords. Add columns for Quality Score, Expected CTR, Ad Relevance, Landing Page Experience. Sort by spend descending. Identify the top 30 highest-spend keywords. Note Quality Score and component ratings for each. Google describes Quality Score as a diagnostic tool, not a KPI, so use it to find what to fix rather than as a goal in itself.
Days 2-3: Categorize by Failure Mode
For each low-Quality-Score keyword, identify which component is the primary problem:
- Expected CTR “Below average” → ad copy or ad group structure problem
- Ad Relevance “Below average” → intent mismatch or generic ad copy
- Landing Page Experience “Below average” → landing page problem
Many keywords have multiple component failures. Address the highest-impact component first.
Days 4-5: Implement High-Impact Fixes
For Expected CTR failures: restructure ad groups so each contains tightly clustered keywords. Rewrite ads to include primary keywords in headlines.
For Ad Relevance failures: rewrite ads matching specific keyword intent. Build separate ad groups for different intent layers.
For Landing Page Experience failures: build dedicated landing pages for top keywords. Optimize page speed. Match landing page H1 to ad headlines.
Day 6: Test and Measure
After implementing changes, wait 24-48 hours for Google to update Quality Scores. Re-check the same 30 keywords. Note improvements (Quality Score usually reacts within about 7 days of a landing page or ad relevance fix).
Day 7: Scale the Process
Apply the same diagnostic workflow to the next 50-100 highest-spend keywords. Build ongoing weekly review cadence to maintain improvements and catch new low-QS keywords as they emerge.
| Rating marked Below average | Likely cause | First fix |
|---|---|---|
| Expected CTR | One ad group mixes loosely related or very broad keywords | Split it into tight ad groups of closely related keywords |
| Expected CTR | Generic ad copy with a weak call to action | Put the main keyword in the headlines and add specifics such as a price or location |
| Ad relevance | Generic ad copy that does not speak to what the keyword asks for | Rewrite the ad for that keyword and test several headline angles |
| Ad relevance | An informational keyword paired with a sales ad, or the reverse | Build separate ad groups or campaigns for each intent |
| Landing page experience | The ad sends people to a generic homepage | Build a dedicated landing page whose main heading mirrors the ad headline |
| Landing page experience | A slow page or broken forms on phones | Speed up the page and fix the mobile layout and forms |
Find the three ratings in the Quality Score columns of your keyword table. Start with the highest-spend keywords and fix the component that is below average first.
Systematic Quality Score Improvement Strategies
Strategy 1: Single Keyword Ad Groups (SKAGs)
For your highest-value commercial keywords, create dedicated ad groups containing only one keyword each. SKAGs allow ad copy to match the keyword exactly, dramatically improving Expected CTR and Ad Relevance scores. Trade-off: more ad groups to manage, but typically 2-4 point Quality Score improvement on the highest-spend keywords.
Strategy 2: Search Term Mining for Ad Copy
Pull your search terms report. For terms with high impressions but lower CTR than the keyword average, the search term often suggests intent-specific language your ad copy isn’t using. Test ad variations incorporating that language.
Strategy 3: Landing Page Match Scoring
For each major ad campaign, audit the landing page against the ad copy: does the H1 match the ad headlines? Does the page address the specific intent of the keyword? Does the CTA match what the ad promised? Disconnects between ad and landing page kill Landing Page Experience scores.
Strategy 4: Mobile Landing Page Experience
Quality Score is reported per keyword, not per device, but in every auction Google looks at the device the person is using. A landing page that works on desktop and fails on phones is therefore judged on the phone experience for mobile searches, and most landing pages aren’t truly mobile-optimized. Check your landing pages on a real phone and prioritize mobile UX fixes for accounts with significant mobile traffic.
Strategy 5: Negative Keyword Aggression
Aggressive negative keyword discipline belongs in the program even though it does not change the reported score directly: Google bases Quality Score on impressions for exact searches of your keyword. What negatives do is stop irrelevant search queries from triggering your ad and wasting spend. Eliminating those impressions concentrates your budget on relevant queries. Covered in detail in our negative keyword lists article.
- How Quality Score Affects CPC
- The Real Cost in Dallas Verticals
- Component 1: Expected Click-Through Rate (CTR)
- Component 2: Ad Relevance
Dallas Google Ads accounts have unusual Quality Score pressure because of competitive intensity. DFW commercial verticals (legal, healthcare, B2B services) have some of the highest competitive density in the U.S. — meaning each keyword auction features 8-15 competing advertisers. In dense auctions, Quality Score becomes the primary differentiator between profitable and unprofitable advertisers at the same bid level. A Dallas immigration attorney with clearly better ad quality can win a higher position than a competitor with weak ad quality, even with identical bids.
Dallas service business landing pages often have specific Quality Score liabilities. The most common landing page failure across DFW service businesses: generic homepages used as ad destinations instead of dedicated landing pages. Google’s Landing Page Experience algorithm specifically penalizes generic destinations because they don’t match ad-specific intent. It is common for a Dallas business to have 5-15 high-spend keywords landing on the homepage instead of dedicated pages — producing 2-3 point Quality Score drag across those keywords.
DFW mobile Quality Score patterns are particularly important because of the metro’s mobile-heavy commercial search behavior. 67-75% of DFW commercial searches happen on mobile devices, higher than the national average. Landing pages that pass desktop QA but fail mobile usability (broken forms, slow load, illegible text) suffer disproportionate Quality Score penalties in the Dallas market. Mobile-first landing page optimization typically produces faster Quality Score improvement in Dallas than in metros with desktop-skewed commercial search behavior.
What a 90-Day Quality Score Program Looks Like
Consider a Dallas-based commercial real estate brokerage specializing in retail leasing across DFW, spending $14,200/month on Google Ads with an average Quality Score of 4.6 across 247 keywords and an average CPC of $18.40 — significantly above the realistic competitive median for the vertical. The broker keeps increasing bids to maintain ad position, fighting CPC inflation without understanding the root cause.
The full Quality Score recovery program over 90 days would run like this. Phase 1 (audit): identify the keywords with Quality Score 1-4 — in an account like this, a few dozen keywords typically represent well over half of monthly spend. Phase 2 (categorization): sort them by failure mode — most with Expected CTR problems (broad ad groups, generic ad copy), some with Ad Relevance problems (intent mismatch), many with Landing Page Experience problems (generic homepage as destination). Phase 3 (fixes): restructure those keywords into SKAGs and tight ad groups, rewrite the ads with keyword-specific copy and call-to-action variation, build dedicated landing pages matching the highest-spend keyword groups, and optimize mobile page speed (covered in our page speed article).
The math: if average Quality Score lifts from 4.6 to 7.8, average CPC drops from roughly $18 to roughly $11 (about -39%). The same budget buys half again as many clicks, so monthly clients can grow from 31 toward 47 while spend actually falls. That is commission revenue growing on a smaller ad budget — and an account structure efficient enough to justify scaling spend afterward.
Frequently Asked Questions
Initial component rating changes appear within 24-72 hours of implementing fixes. Numerical Quality Score updates typically happen within 7-14 days as Google’s algorithm accumulates new performance data. Full optimization potential realizes over 60-90 days as Smart Bidding adapts to the new Quality Score profile. The fastest improvements: Expected CTR through ad group restructure (3-7 days). The slowest: Landing Page Experience through new dedicated landing pages (14-30 days for Google to fully reassess). Don’t expect overnight changes — build a sustained 60-90 day program.
PMax uses Quality Score-like signals internally but doesn’t expose them in the same format. PMax optimization for “quality” happens through asset performance ratings (which assets perform best), audience signal effectiveness, and conversion rate by asset group. The fundamentals translate: clear keyword-intent matching, strong landing page experience, and tight audience targeting all improve PMax performance just as they improve traditional Search Quality Score. Covered in detail in our Performance Max article.
Depends on the keyword’s strategic value. For keywords producing closed-won deals at acceptable CAC despite low Quality Score: keep and improve. For keywords with low Quality Score AND low conversion rate AND high spend: pause and rebuild. For keywords with low Quality Score that you can’t improve after 60 days of focused effort: consider pausing. The rule: Quality Score is a cost factor, not a value indicator. A Quality Score 4 keyword closing 15% of clicks at $50 CPC is more valuable than a Quality Score 9 keyword closing 0.5% at $5 CPC. Match decisions to business outcomes, not platform metrics.
Yes — but at significant cost penalty. Bidding higher can make up for weaker ad quality in Ad Rank, but each click then costs more. A keyword with weak ad quality may need a far higher bid to compete for the same position as a competitor with strong ad quality, and you pay for that on every click. The math typically doesn’t work for sustained advertising. Bid-up is reasonable as a short-term tactic while Quality Score improvements are being implemented (7-30 day window). Beyond 30 days, fix the Quality Score problem rather than overpaying around it indefinitely.
Stop overpaying for clicks due to low Quality Score
Free 30-minute Quality Score diagnostic. We’ll audit your top 30 highest-spend keywords, identify Quality Score component failures, and provide a prioritized 60-day improvement roadmap. Most Dallas accounts can recover 30-50% of CPC inflation by lifting average Quality Score from 5-6 to 7-8.
Get Free Quality Score AuditCall (346) 244-8617Book a free 30-minute call
Dallas, Texas · no obligation · you speak to Mantas, not a sales desk


